Have you heard about the Performance Monitor, also known as PerfMon.exe or PerfMon.msc? It is a sophisticated tool that can be used to monitor the performance of your Windows computer or device. Using it, you can see how your computer manages its resources. The information it gives you can help you make decisions about software and hardware choices, especially when your computer's performance is below expectations. It is also useful when you want to do some troubleshooting. Here is how to use the Performance Monitor to analyze your system's performance like a pro:
NOTE: This guide works in Windows 10, Windows 7 and Windows 8.1.
How to start the Performance Monitor in Windows
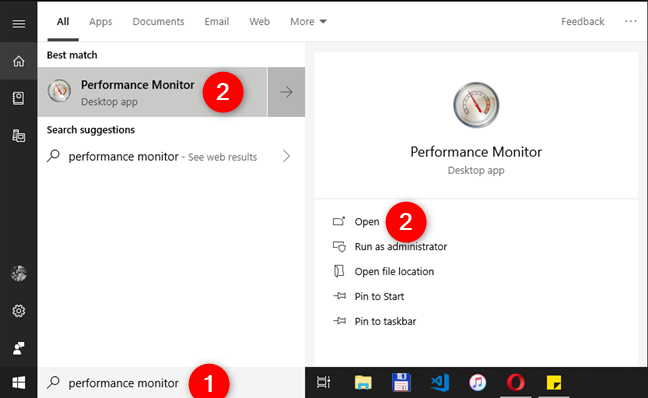
The are many ways to start the Performance Monitor. One that works in all versions of Windows is to use the search. For example, in Windows 10, type "performance monitor" in the search box on the taskbar and then click or tap the appropriate result.
For other ways to open the Performance Monitor in any Windows version, check this article: 11 ways to start Performance Monitor in Windows (all versions).
How to analyze system performance with Performance Monitor
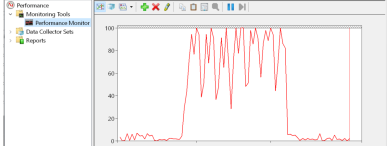
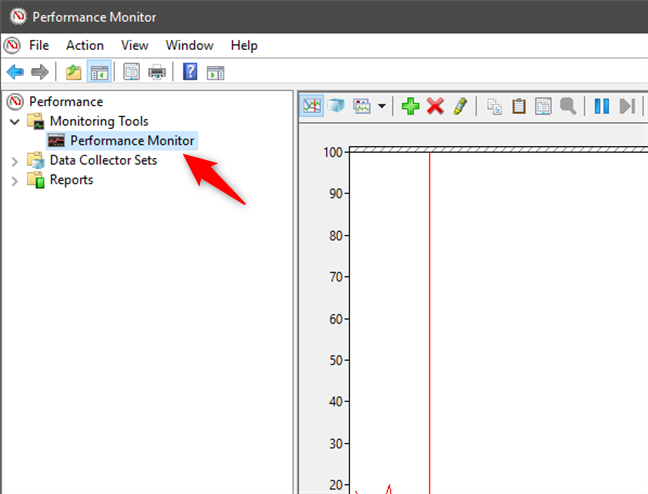
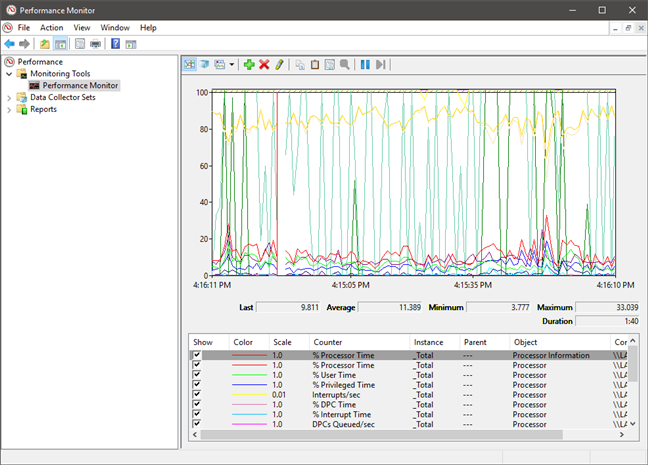
To begin an analysis of your computer's current performance, click or tap on Performance Monitor under Monitoring Tools on the program's main panel, as indicated below.
NOTE: If you want to see how your computer performs while using a particular set of apps and programs, make sure to open them now so that the graphs can take note of their impact on your system's resources.
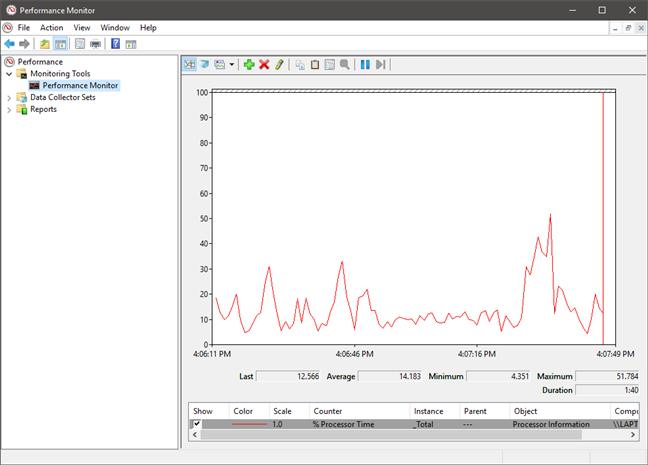
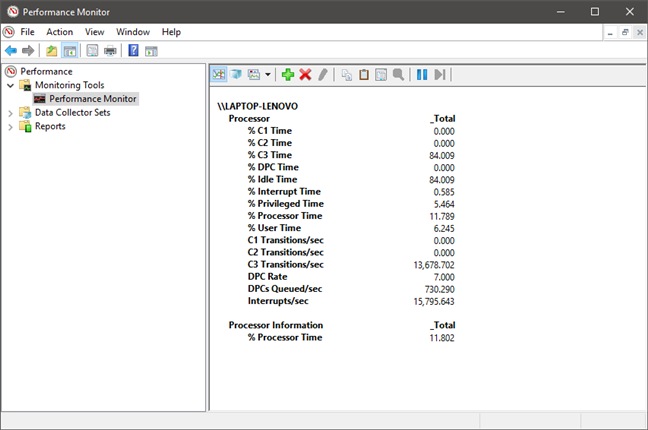
By default, the graph shown by Performance Monitor measures Processor time, which is the amount of time that the processor is busy working on running active programs (shown in percentages). This gives you a basic measure of how hard your processor is working.
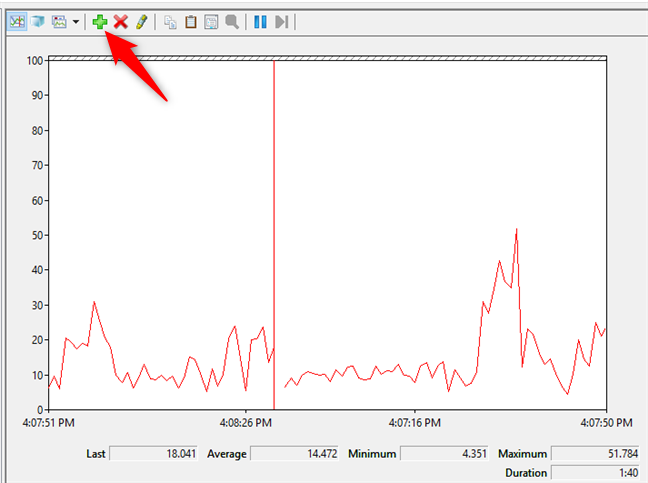
This graph can be customized with additional columns and several other options. For a more in-depth analysis, you can also add counters to the graph that can detail other data. To do this, hit the green plus sign above the graph.
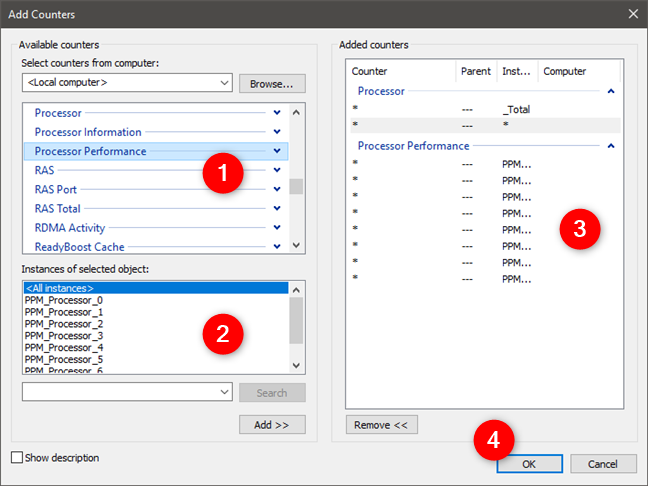
In the Add Counters window that opens, you can select the counters that you want to monitor in real time. They are organized by type and they are many. If you double-click (double-tap) on the name of a counter, you should see several individual objects and you can select to monitor any of them, as well as all of them.
When you are done selecting the counters and the objects that you want to monitor, click or tap the Add button. The added counters are shown on the right side of the window. When you click or tap OK, they are added to the graph from the Performance Monitor.
For example, in the graph below, we used the Processor counter set. It shows technical but useful data such as Interrupts/sec (the numbers of interrupts your processor was asked to respond to. They are generated by hardware components like hard disk controller adapters and network interface cards) or %User Time (the total amount of non-idle time that was spent on user mode operations).
Now you can go ahead and perform the activities that you want to be monitored, using the selected counters and see how they change in real time.
How to customize the way data is displayed in Performance Monitor
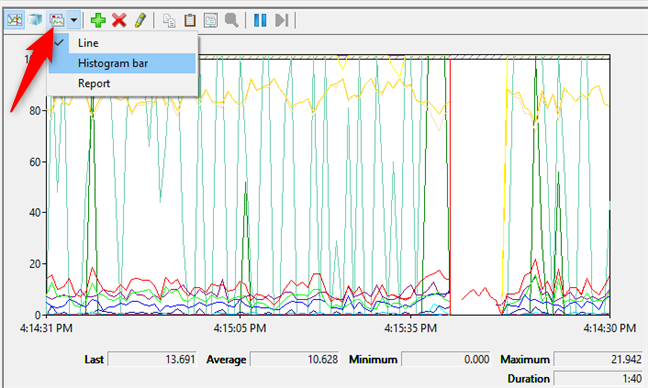
You can also look at the data in other formats by clicking or tapping on the "Change graph type" button (or by hitting CTRL + G on your keyboard) and choosing the Histogram bar or Report options.
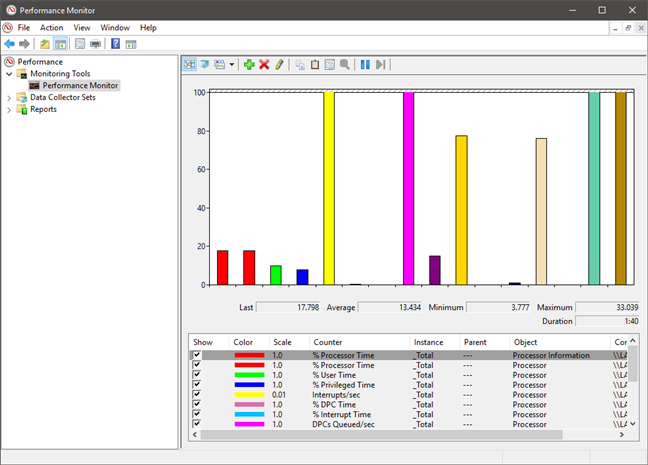
This picture shows the data in Histogram format.
And here we have an example of the data display for the Report option.
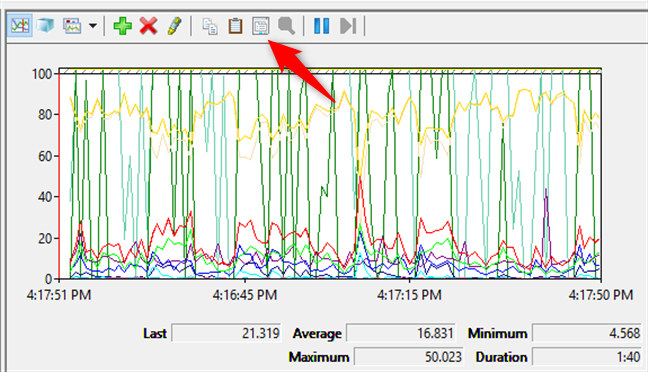
You can further change how the data is displayed, by clicking the Properties button highlighted below or by pressing CTRL + Q on your keyboard.
This opens the Performance Monitor Properties window, where you can customize how each counter is displayed, in what color, using which type of lines and so on. You can use both the Data and the Graph tabs for this type of personalization.
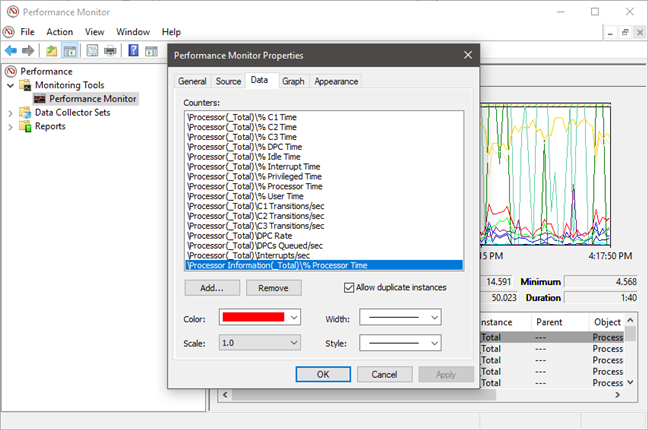
When you are done personalizing everything as you wish, do not forget to press the OK button.
Which are the most useful Performance Monitor counters?
The data included in the Performance Monitor's graphical reports are highly technical and difficult to understand by casual users. However, there are a few counters that are more useful than others, at least for the regular user with a Windows computer in his or her desk. Here is a selection of performance counters that can help you see whether something is not working right:
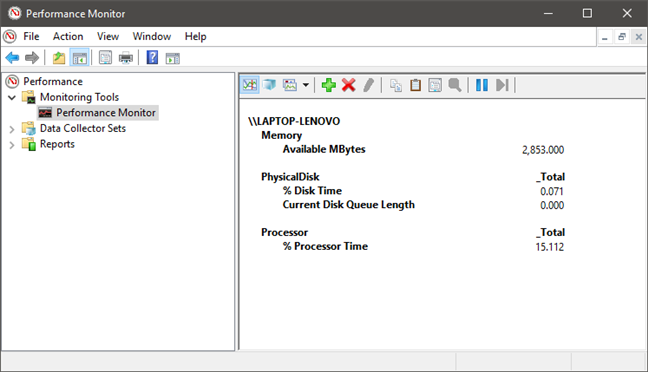
- Processor -> % Processor Time: you can find it in the Processor list of counters. It shows you the time spent by the processor on various tasks. If its value is consistently above 80%, it means that your processor is not powerful enough to sustain everything you do on your computer, so it becomes a bottleneck. Although a solution to this issue would be to use less demanding apps on your computer, the only long-term solution is to upgrade your processor.
- Memory -> Available MBytes: is found in the Memory list of counters. You can add this counter to your graph to see whether your system has enough memory available to use. If the graph shows you that the available memory is somewhere less than 10 percent of your total amount, it could mean that you do not have enough RAM installed. In that case, consider adding some more.
- PhysicalDisk -> Current Disk Queue Length and PhysicalDisk -> % Disk Time: these two counters are found both in the PhysicalDisk list. If the Current Disk Queue Length is higher than 2 and the Disk Time is closing on 100%, it is likely that the hard drive that you are watching is too slow or even faulty. In that case, you might want to consider upgrading your hard drive.
How to make sense of all the data that is available in Performance Monitor
Unfortunately, the list of counters available in Performance Monitor is exceptionally long and we cannot cover everything in just one article. However, if you are looking for a good knowledge base, explaining all the gibberish terms like %DPC Time or Page Faults/sec, read this entry on Microsoft's TechNet: Performance Monitor Counters. There you will find complete information about each counter found in the standard list of reports.
Do you use the Performance Monitor to find the bottlenecks in your system?
This article has shown you how to open and get an essential reading of Performance Monitor reports and how to apply counter sets to monitor the activity of your system further. We have also shown a few useful counters that can help you perform an analysis of the main hardware parts in your Windows computer. Did you use the Performance Monitor for troubleshooting your PC? Let us know how you use this tool and whether it was helpful for your purposes.