Although Task Manager's Processes tab offers detailed information about how programs use system resources, it is the Details tab that allows you to find out everything you need to know about running processes (and more). Task Manager's Details tab provides generous data about each process running on your Windows 10 computer or device, and it can come in handy during advanced troubleshooting. In this tutorial, we go over the massive amount of information that it offers and what it can do:
NOTE: The screenshots and the instructions in this guide apply to Windows 10 May 2019 update or newer. If you do not know what version of Windows 10 you have, read: How to check the Windows 10 version, OS build, edition, or type.
First things first: Access the Details tab in Windows 10's Task Manager
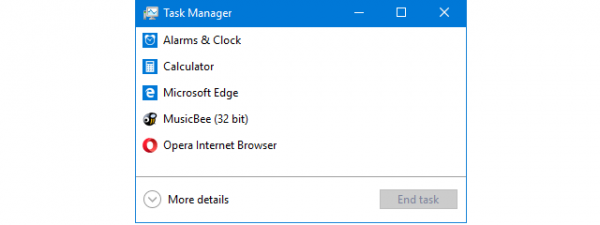
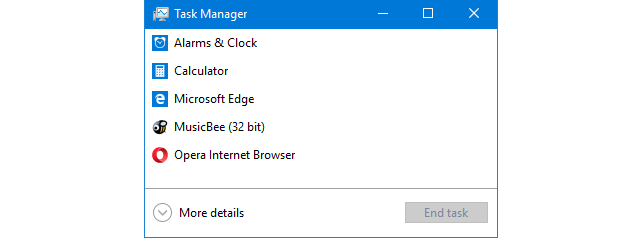
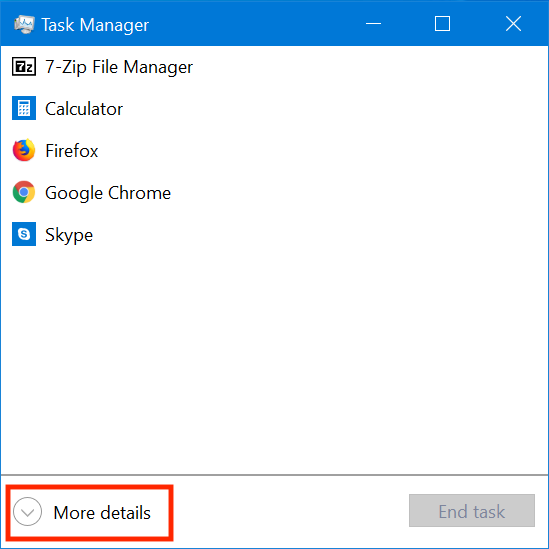
To begin, launch the Task Manager. We used the keyboard shortcut "Ctrl + Shift + Esc." Click or tap on More details if the Task Manager starts in its compact view.
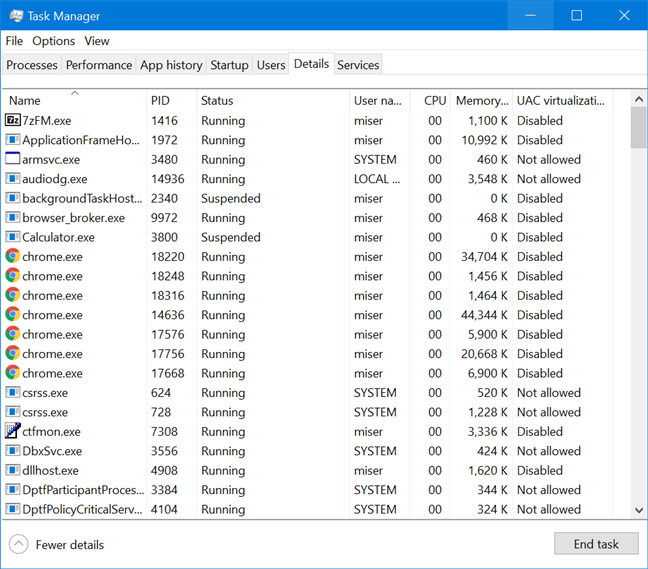
Then, click or tap the Details tab.
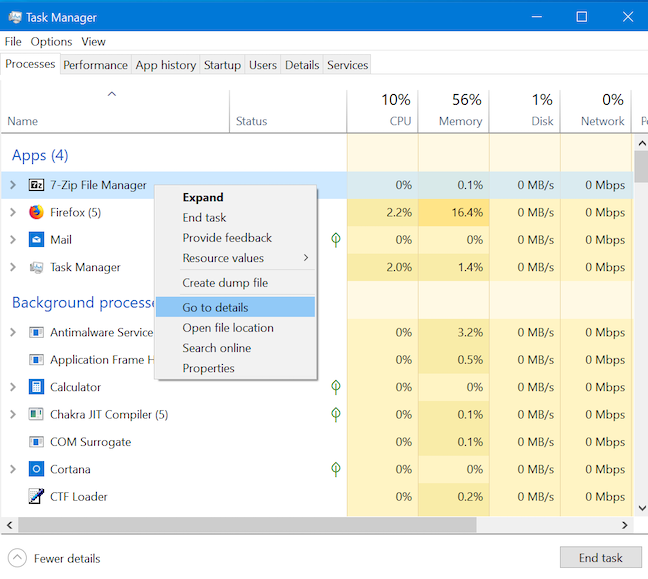
If you need to access more details for a specific process, right-click or press-and-hold on it in the Processes tab and then click or tap "Go to details" to open the Details tab.
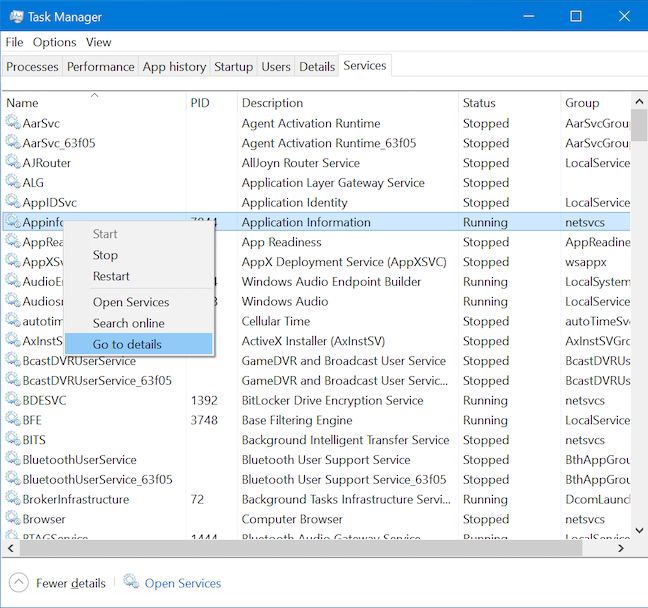
You can do the same from the Services tab, by right-clicking or pressing-and-holding on any running service, and then clicking or tapping "Go to details."
The default data displayed in Task Manager's Details tab in Windows 10
The Details tab in Windows 10's Task Manager shows a lot of information when you first access it. You might feel overwhelmed at first.
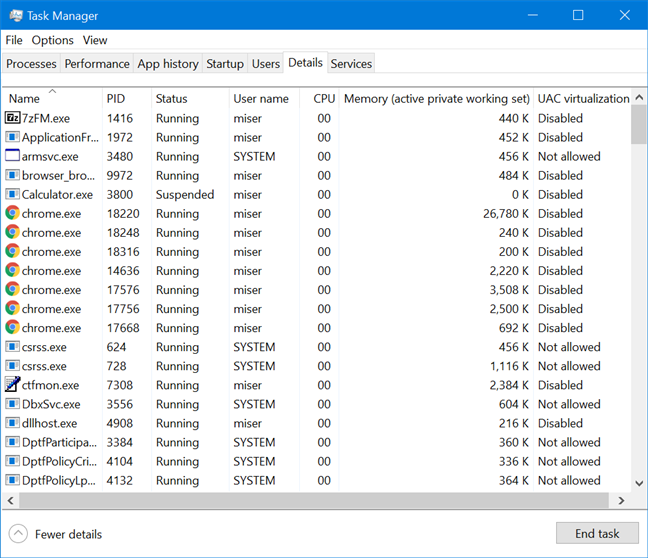
This data is displayed in seven default columns:
- Name - Shows the name of the running process. It is the only column that can not be hidden from view.
- PID - Displays a unique Process Identifier number. These numbers can be used to match a running service with an error or event that lists the PID.
- Status - Displays whether a process is running or suspended. Universal Windows Platform apps are suspended to conserve resources when they are not used.
- User name - Reveals the name of the user (including system accounts) a process is running under.
- CPU - Shows the percentage of CPU used by each process across all cores.
- Memory (active private working set) - Displays the amount of memory used and reserved for each process, excluding data from suspended UWP processes.
- UAC virtualization - Indicates if User Account Control virtualization is Enabled, Disabled, or Not allowed for each process. We return to the topic of UAC virtualization later on, when we explain how the Details tab allows you to change the virtualization of a process.
The additional columns you can add to Task Manager's Details tab in Windows 10
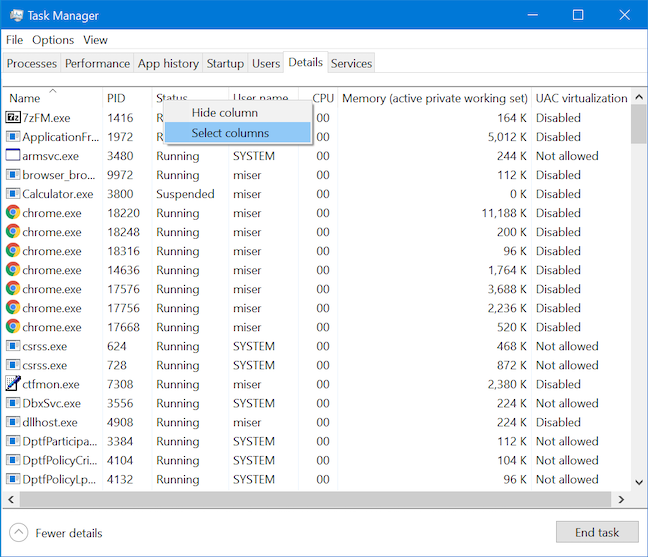
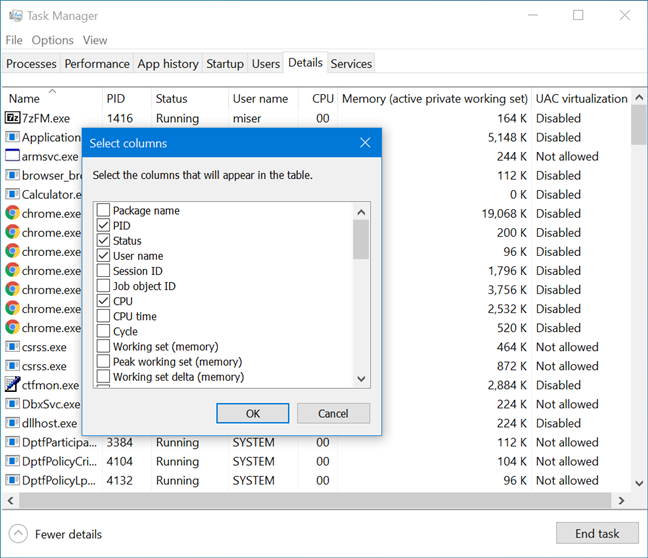
If you want to add more information to the tab, there is a lot to choose from. To see what you can add, right-click or press-and-hold a column header and click or tap Select columns.
The Select Columns window opens, revealing forty more columns that you can add to the Details tab, on top of the ones we already went over. Just select the ones you want to be displayed and then click OK to have them added to the Details tab.
Hovering over a column header should give you an idea about the data that column displays. Here is what each of them shows:
- Package name - Shows the name of a package that a UWP app belongs to. The column is empty when it comes to non-UWP apps.
- Session ID - Displays the unique number of the user session running a process and can be matched with the ID number shown in the Users tab.
- Job object ID - Shows the ID of the job object in which the process is running.
- CPU time - Reveals the total processor time in seconds used by each process since it started running. This data resets if a process is restarted.
- Cycle - Displays the current percentage of CPU cycle time a process is using.
- Working set (memory) - Shows the amount of physical memory currently used by each process.
- Peak working set (memory) - Shows the maximum amount of physical memory used by each process.
- Working set delta (memory) - Displays the amount of change in working set memory each process has used from the last refresh.
- Memory (private working set) - Shows the amount of memory used and reserved for each process, including data from suspended UWP processes.
- Memory (shared working set) - Displays the amount of memory used by each process, that can be used by other processes if needed.
- Commit size - Shows the amount of virtual memory reserved by Windows 10 for each process.
- Paged pool - Displays the amount of pageable kernel memory allocated by the Windows kernel or drivers for each process. Pageable memory can be written to another storage medium, like a hard-disk.
- NP pool - Shows the amount of non-pageable kernel memory allocated by the Windows kernel or drivers for each process.
- Page faults - Reveals the number of page faults each process generated since it started running. Page faults occur when a process attempts accessing memory that is not currently allocated to the process.
- PF Delta - Displays the change in the number of page faults generated by each process from the last refresh.
- Base priority - Shows the current priority of each process, this ranking determining the order in which the threads of a process are scheduled. We return to this when we go over how you can change the priority of a process.
- Handles - Displays the current number of handles that each process opened. A handle is a system resource such as a file, a registry key or a thread.
- Threads - Shows the number of active threads for each process.
- User objects - Displays the number of window manager objects that each process uses. Window manager objects include windows, menus, cursors, keyboard layouts, and monitors.
- GDI objects - Reveals the number of Graphics Device Interface objects used by each process to draw the user interface.
- I/O reads - Shows the number of read Input/Output operations generated by each process since it started running, including file, network, and device I/O.
- I/O writes - Displays the number of write Input/Output operations generated by each process since it started running, including file, network, and device I/O.
- I/O other - Shows the number of non-read and non-write Input/Output operations, generated by each process since it started running — e.g., control functions.
- I/O read bytes - Displays the total number of bytes read by each process in Input/Output operations.
- I/O write bytes - Shows the total number of bytes written by each process in Input/Output operations.
- I/O other bytes - Reveals the total number of bytes a process used in non-read and non-write Input/Output operations since it started — e.g., control functions.
- Image path name - Displays the full path to the executable file corresponding to each process.
- Command line - Shows the full command line used to launch each process, including command-line arguments.
- Operating system context - Displays the minimum operating system that each process can run on if the corresponding manifest file has that information. This field remains blank for most processes, but can also show older Windows versions — e.g., Windows Vista, Windows 7.
- Platform - Shows the platform each process is running on: 64 bit or 32 bit.
- Elevated - Specifies whether the process is running with administrator privileges (elevated) or not.
- Description - Displays a short text description of what the process is.
- Data execution prevention - Specifies whether Data Execution Prevention, which is a security feature, is enabled or disabled for each process.
- Enterprise context - Shows the context of each process while running in Windows Information Protection (WIP) to make sure that your organization's policies are applied and running correctly.
- DPI Awareness - Displays the default mode for how the application interacts with high DPI (dots per inch) displays.
- Power throttling - Shows if power throttling is enabled or disabled for each process. Some processes can be automatically throttled when you are not using them, to conserve the battery of your Windows 10 device.
- GPU - Displays the highest utilization across all Graphics Processing Unit engines.
- GPU engine - Shares which Graphics Processing Unit engine is utilized the most by each process.
- Dedicated GPU memory - Displays the total amount of dedicated graphics memory that each process is using across all Graphics Processing Units.
- Shared GPU memory - Shows the total amount of system memory that each process is using across all Graphics Processing Units.
Hide columns from view in Task Manager's Details tab
As you can imagine, having all forty-six optional columns activated can seriously overcrowd your Task Manager's Details tab, so it might be easier to only keep the ones that interest you. If you have a column open that you no longer need, you can hide it from view by right-clicking or pressing-and-holding the column's header and then choosing Hide column.
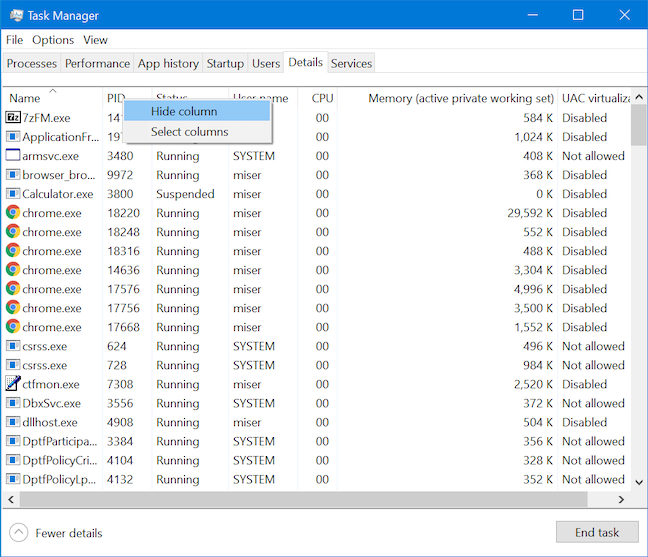
If you want to hide more columns from view at the same time, it might be simpler to right-click or press-and-hold on a column's header and then click or tap Select columns from the contextual menu.

The Select Columns window opens, and you can uncheck any unnecessary columns to hide them from view. Just click OK when you are done, to have them removed from the Details tab.

Sorting options in Task Manager's Details tab
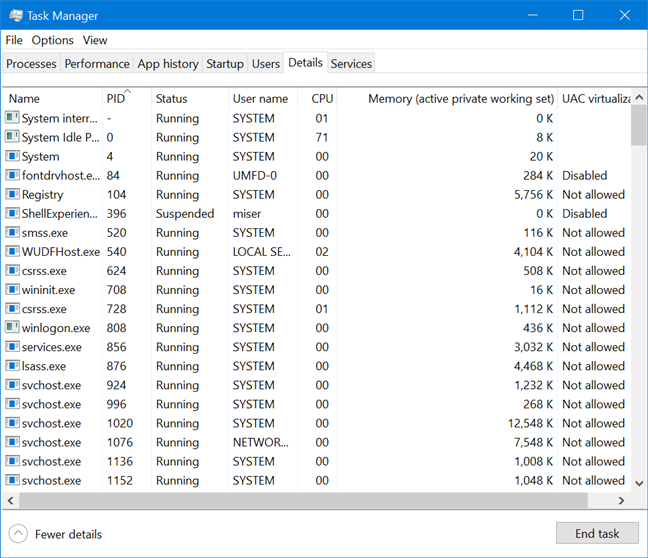
By default, the processes in the Details tab are sorted alphabetically. Clicking on any of the column headers sorts the data displayed based on the values shown in that column.
If you are happy with the data displayed but want to change the order in which it appears, click or tap and then drag a column's header to move that column left or right.
End processes from Task Manager's Details tab in Windows 10
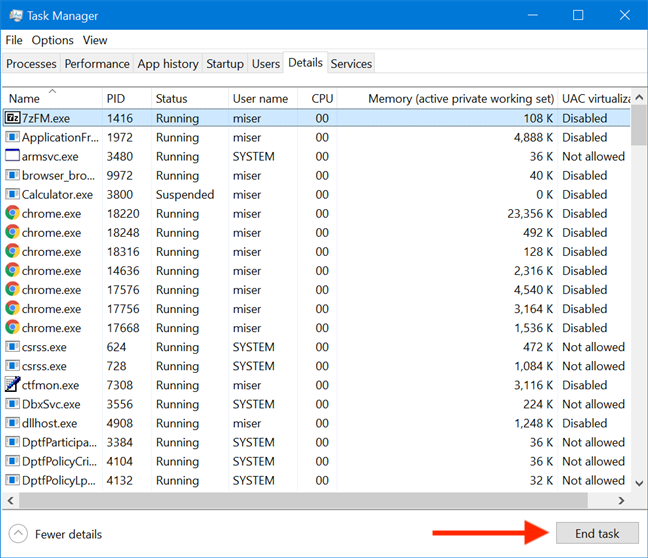
One of the most common uses for the Details tab is to stop processes quickly, to free up system resources. To end a process, select it and then click or tap the End task button from the bottom-right corner of the Task Manager.
You can also right-click or press-and-hold on any process to open a contextual menu. Click or tap on End task to close that task.
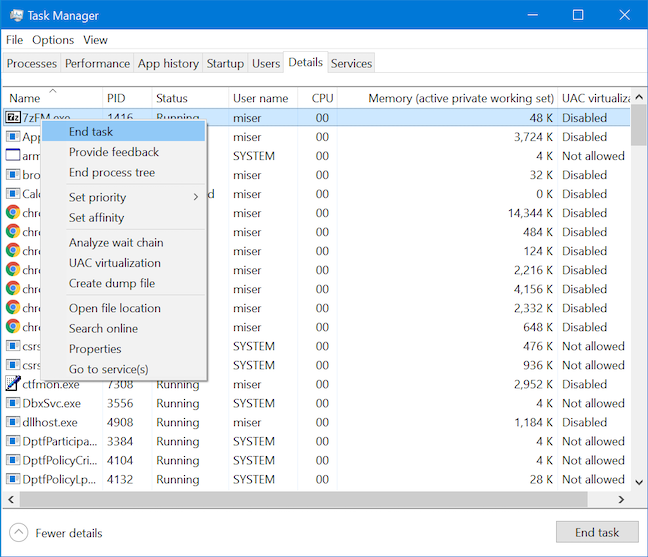
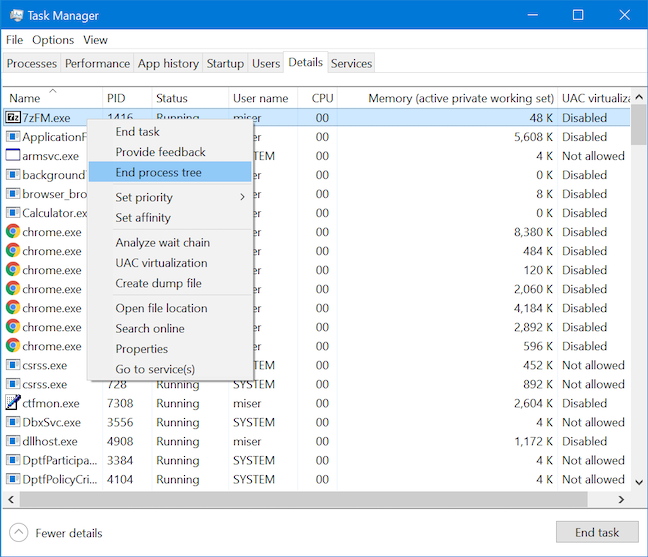
You can click or tap "End process tree" from the same contextual menu if you want the entire process tree to be terminated.
Provide feedback on a process to Microsoft from Task Manager's Details tab
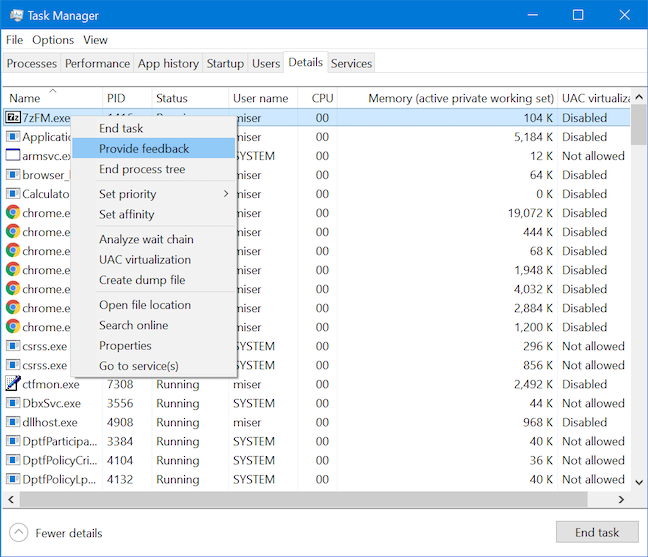
The Details tab now allows you to quickly provide feedback to Microsoft on any listed process. Just right-click or press-and-hold to open the contextual menu and then click or tap Provide feedback.
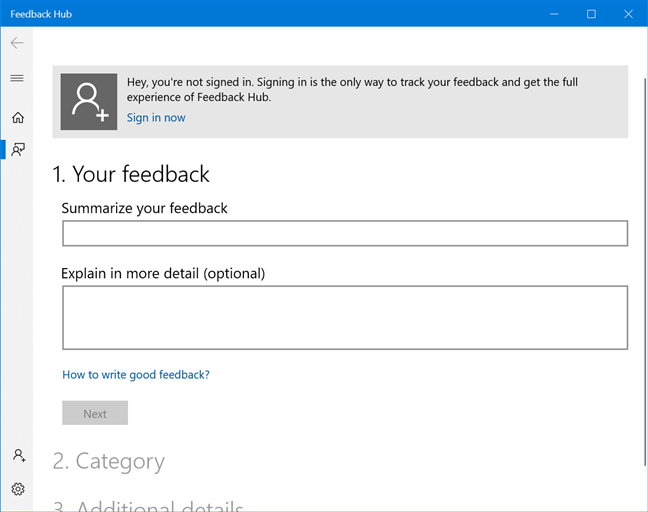
The Feedback Hub opens, and, once you to sign in with your Microsoft account, you can send your issue or opinion to Microsoft.
How to change the priority of a process from Task Manager's Details tab
The Details tab lets you see the priority of each process. Windows schedules the threads of a process based on this ranking. However, you can do more with the Details tab and change the priority of a process. Right-click or press-and-hold on a process and hover over the Set priority option to open a menu that not only lets you see a process's current priority but also allows you to choose a new priority level.
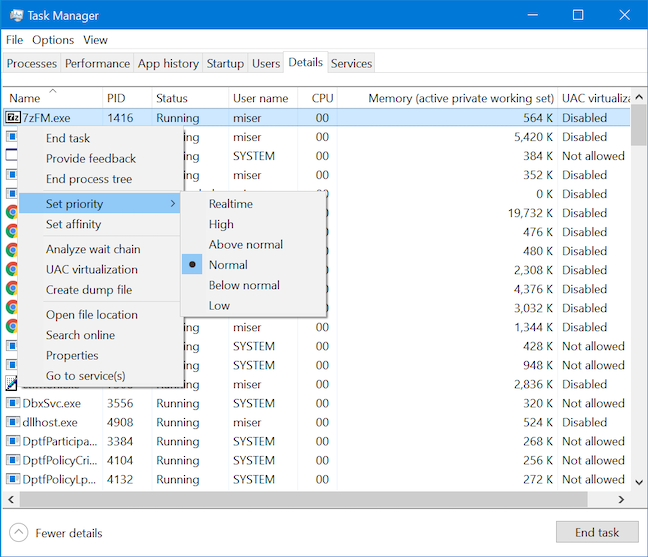
The Set priority menu displays six possible priority levels: Realtime, High, Above normal, Normal, Below normal, and Low. Most processes have a normal priority level and, while raising the priority of a process should make it run better, it could destabilize the rest of your system and even cause a crash. To avoid performance issues, never raise priority more than a single step at a time. If you want to raise it even higher, test each step before progressing further. The Realtime priority is also tricky, and we suggest leaving it alone, as recommended by Microsoft.
Link a process to a particular processor from Task Manager's Details tab
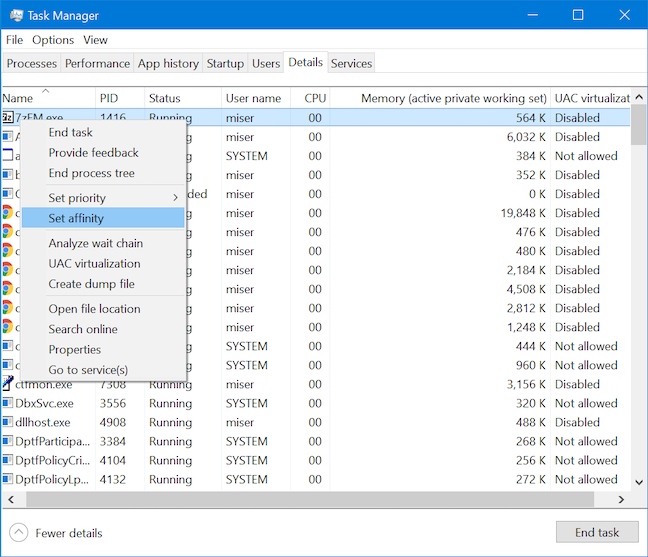
The Details tab offers yet another option to change the way a process runs on your Windows 10 computer or device, allowing you to select a particular processor or core on your system that you want a process to run on. This can be useful because some processes run on all processors on your system by default, and limiting them to a particular processor can help increase efficiency and maximize your system performance. Right-click on press-and-hold on a process to open the contextual menu. Then click or tap on Set affinity to start linking that process to a processor or core.
When the Processor affinity window opens, choose the core or cores you want the process to run on and then click or tap OK.
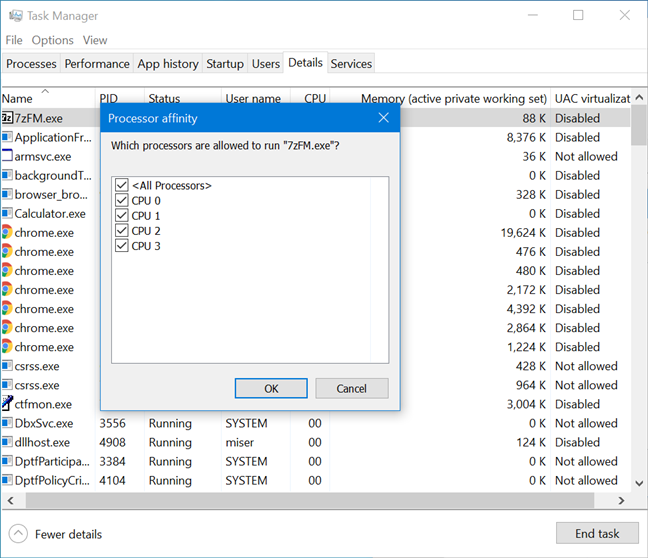
While it may seem like a good idea to let Windows divvy up the load evenly among all cores, certain older applications, like old games from the 90s or 2000s that were designed for a single-core processor, might run better when pushed onto a single core.
Troubleshoot problem processes using Task Manager's Details tab
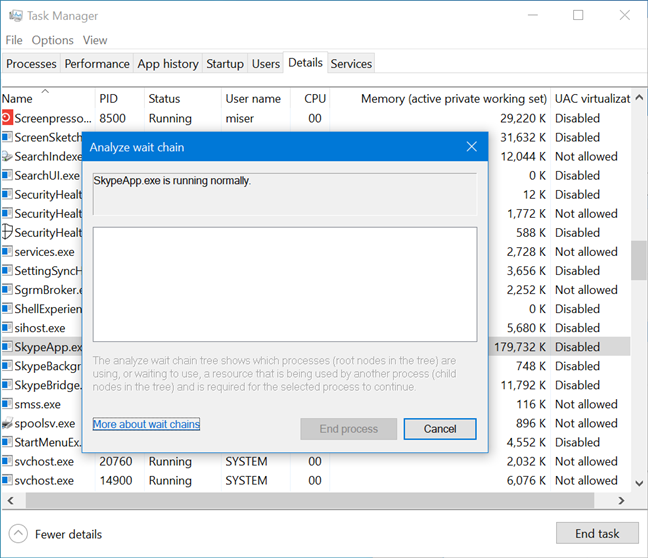
Not only can you change how programs run on your computer using the Details tab, but you can also get information that might help you resolve certain issues. If you have a program lock up and become unresponsive, you can right-click or press-and-hold on it in the Details tab to open its contextual menu and then press on "Analyze wait chain."
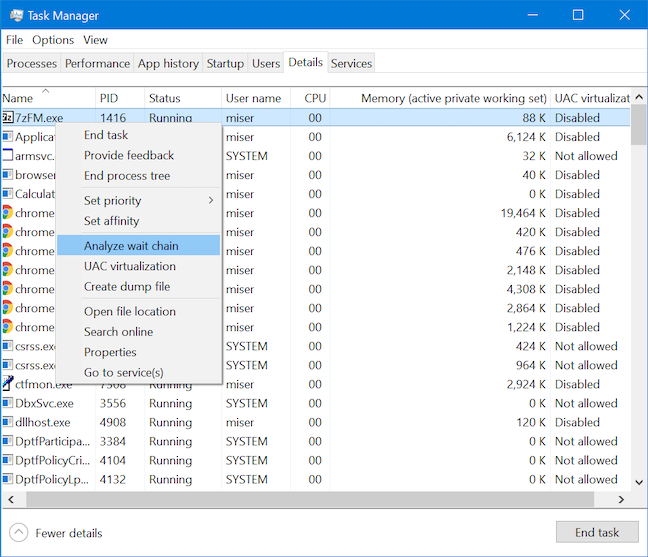
The "Analyze wait chain" window opens, allowing you to examine the process and list all subprocesses that are currently attempting to complete a task. Killing these subprocesses often frees up the parent process allowing you to save data that might otherwise be lost. You can also research the offending subprocesses to see why they may be using resources so heavily.
If a running process has no current issues, it shows displays a message informing you it is running normally.
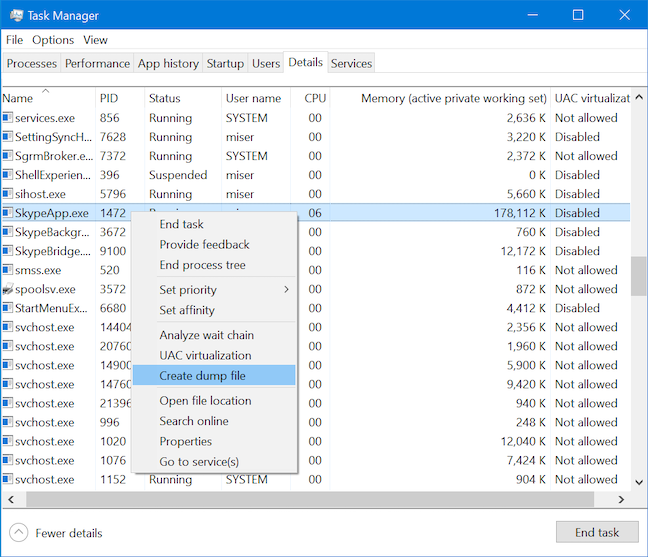
If there is a process that is giving you trouble, such as performance issues, freeze-ups or errors, you can create a dump file that provides a detailed account of everything that your process is doing in memory at the time the dump file is created. Right-click or press-and-hold on a process, and then click or tap "Create dump file" from its contextual menu.
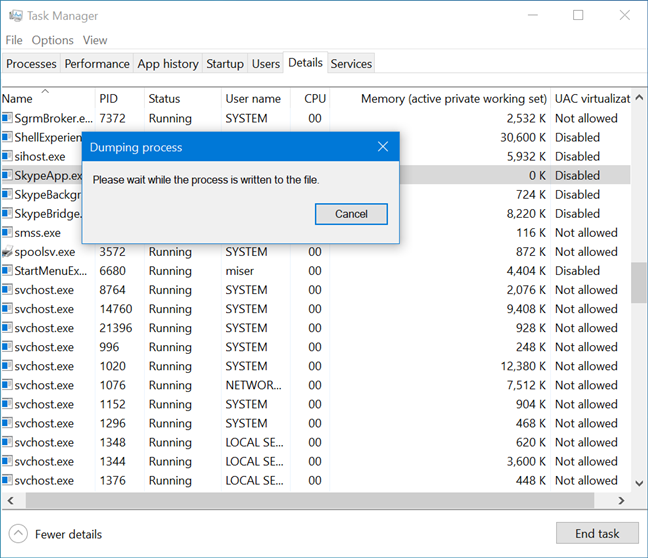
For some processes, this action can take some time, in which case you receive a message asking you to wait in the Dumping process window.
Once the file is created, the Dumping process window lets you know and shares its location. Screenshot the window or remember the path, and then click or tap OK. The generated file can be opened with debugging software such as WinDBG, but most users get more value from this feature by sending the dump file to a tech support agent.
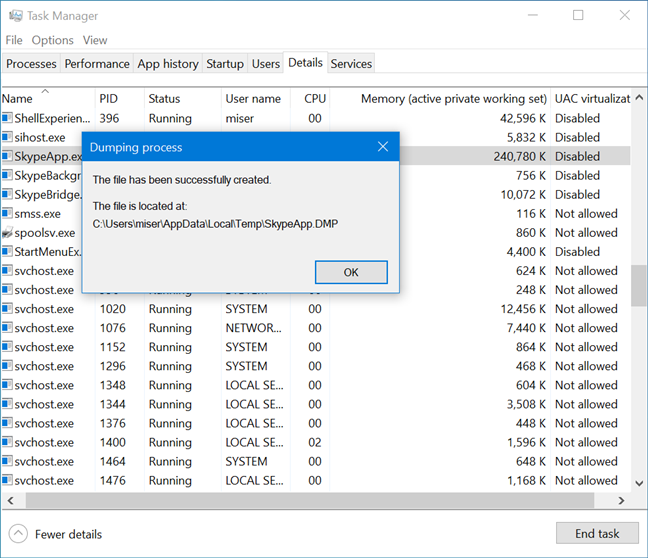
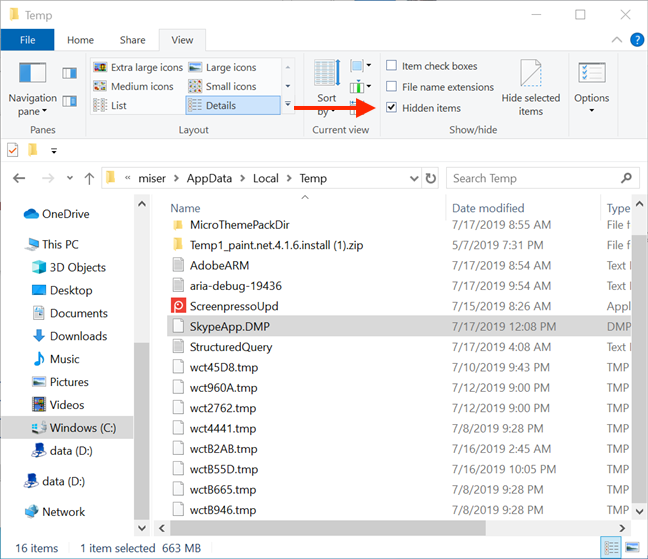
You might need to enable hidden files to access the folder where this file is stored.
Enable UAC process virtualization in Task Manager's Details tab
Another feature accessed from Task Manager's Details tab is UAC Virtualization. This option allows you to enable User Account Control virtualization for a particular program. While most users should have no reason to interact with this feature often, it does serve an important purpose.
Some older applications are configured to write directly to important system locations and require your user account to have admin credentials to run. If you do not want to grant admin rights to any such app, you can enable virtualization from the Task Manager. This causes Windows to recreate important locations, such as the System32 directory and system registry keys, in a virtual environment in order to prevent potential problems from affecting your actual system files.
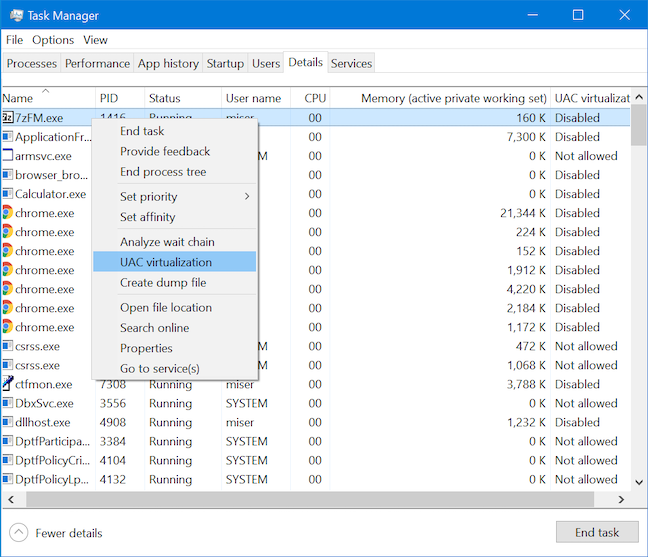
To enable this feature, select UAC virtualization from the contextual menu that shows up after right-clicking or pressing-and-holding on a process.
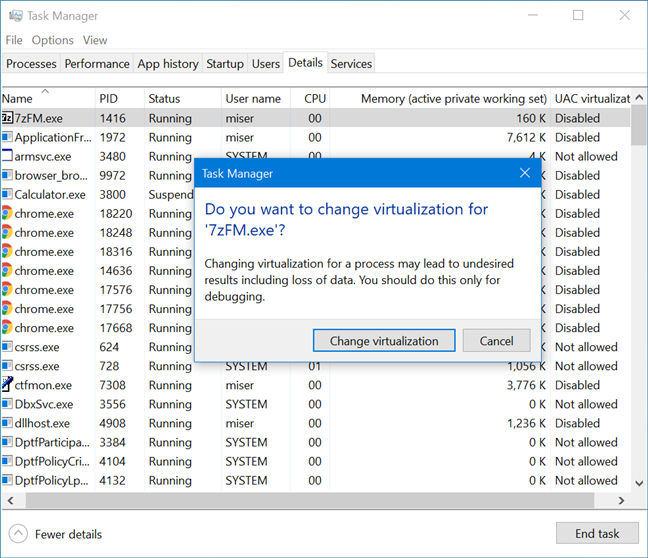
Click or tap Change virtualization to enable or disable the feature for the selected process.
Find the location of a running process from Task Manager's Details tab
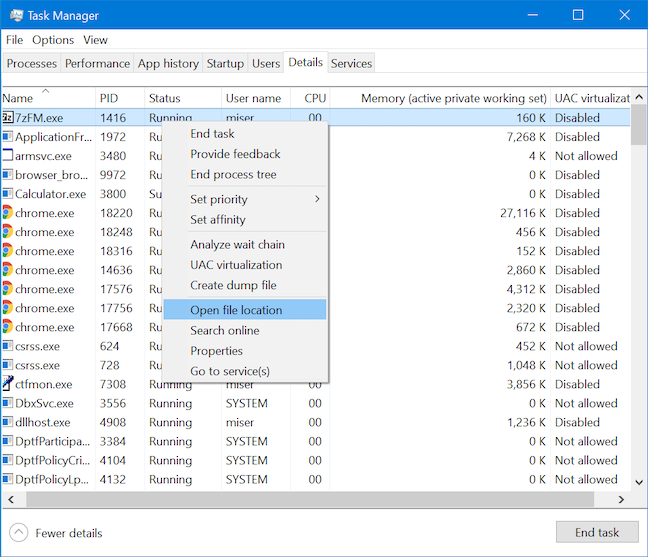
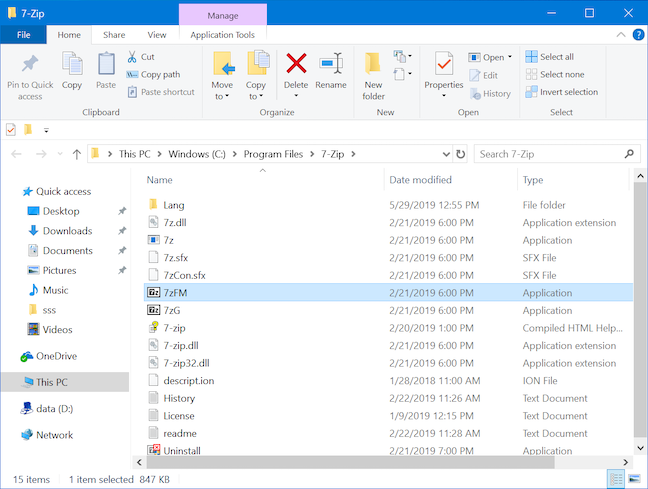
You can find the exact location on your hard drive of the executable file corresponding to a process from the Details tab in Windows 10's Task Manager. Right-click or press-and-hold on a listed process and click or tap "Open file location."
The File Explorer opens the folder your application's executable file is stored in. The corresponding file is highlighted when the folder opens.
Research an unknown process using the Details tab in Windows 10's Task Manager
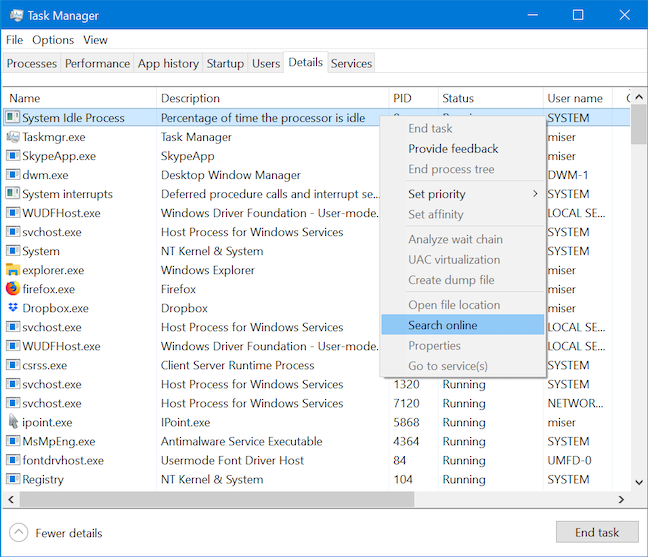
You might come across an unknown process that is eating up your resources. The Details tab offers the option to research that process and understand what it is all about. Right-click or press-and-hold on a process and then click or tap Search online.
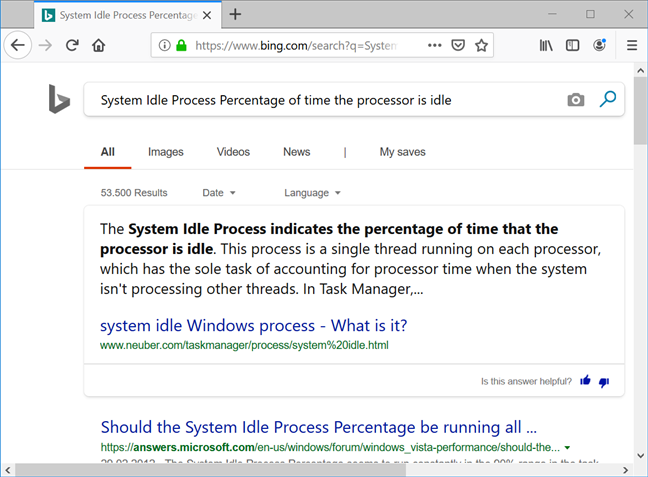
Your default web browser opens a new tab, and runs a web search with the name and description of the process on Bing (regardless of your default search engine), helping you get more information on it.
View the properties of a process from Task Manager's Details tab
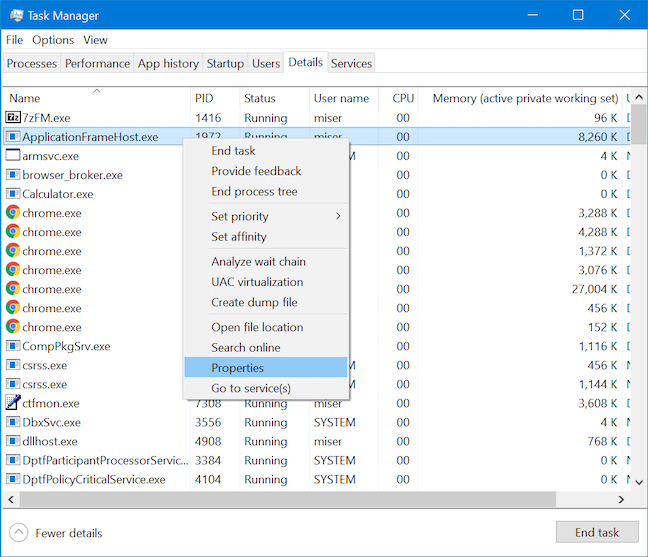
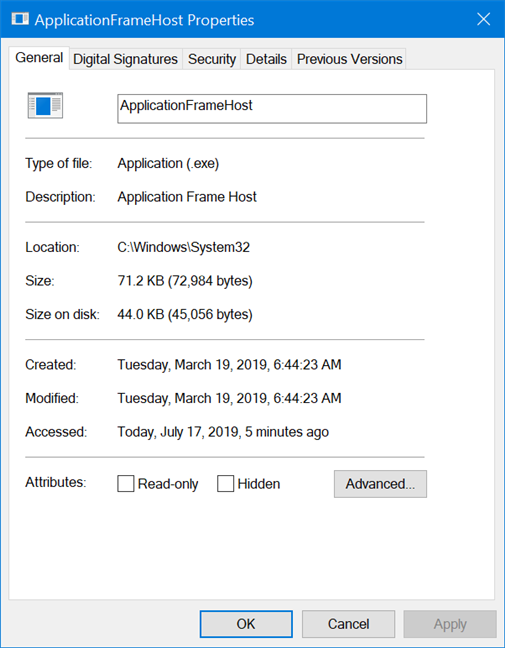
The properties of a process can offer a lot of information about the executable that runs it. They show the file's size, location, access dates, and security settings, and you can even troubleshoot compatibility issues. Right-click or press-and-hold on a process listed in the Details tab of your Task Manager and click or tap Properties.
The Properties window opens, providing you access to useful information about the selected process.
Switch to the Services tab to see any services associated with a process from Task Manager's Details tab
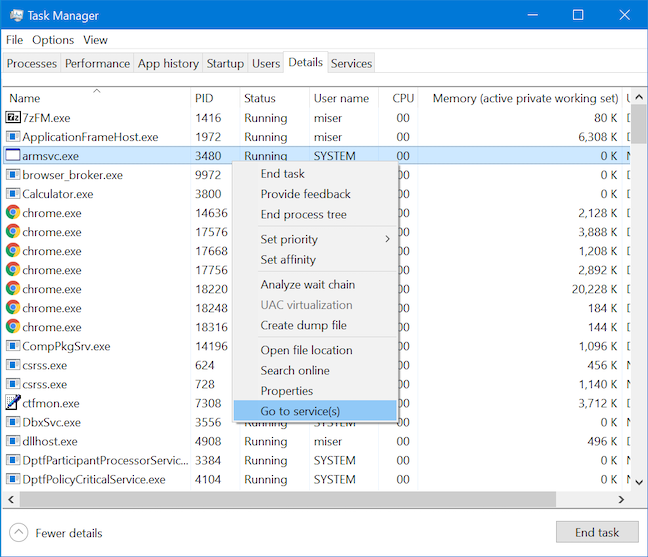
Some of the processes listed in the Details tab have a corresponding service displayed in the Services tab. Right-click or press-and-hold on a process and then click or tap "Go to service(s)."
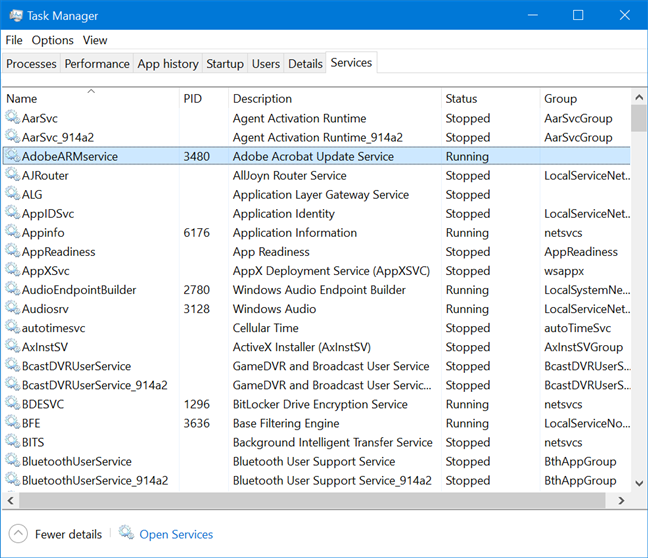
This action switches you over to the Services tab and highlights any service(s) associated with the chosen process. If there are no such services, it just switches to the Services tab and selects nothing.
How cluttered is the Details tab from your Task Manager?
Thank you for taking the time to read the longest ever tutorial I wrote! When I finally finished writing it, I found my Details tab was cluttered with all the different columns I kept adding and hiding. We know the wealth of detailed information available on this tab is invaluable for power users and tech support agents, but is there anyone who actually has at least half of the forty-six columns open in their Task Manager's Details tab? If you are out there, let us know, and maybe we can all find out new ways this tab can be used for a maximum of efficiency.