When Windows slows down or freezes, we usually turn to the Task Manager to figure out what is going on. If you need a better understanding of the way Windows and its apps use the resources of your computer, Resource Monitor (resmon.exe) is the right tool for the task. The information is concise and real-time with graphs and grouping by resources. You can monitor the use of the CPU, memory, disk, and network. This tutorial shows what you need to know about Resource Monitor and how to use it:
NOTE: This guide works for all modern Windows versions: Windows 10, Windows 7 and Windows 8.1. Because the Resource Monitor tool looks and works the same in all Windows versions, we use screenshots taken only in Windows 10.
How to start the Resource Monitor in Windows
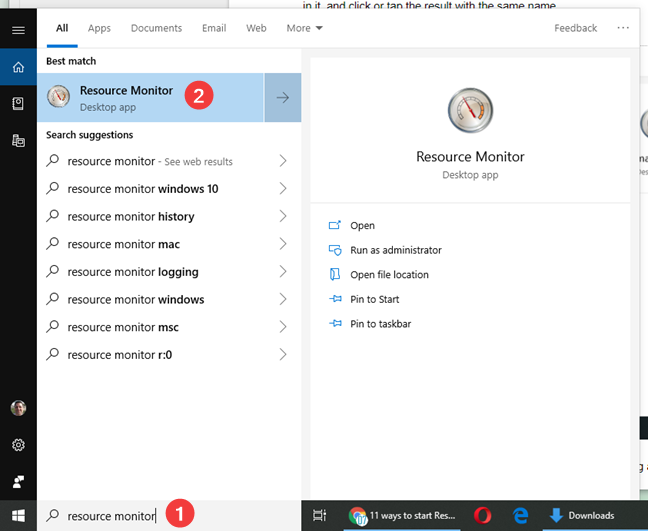
An easy way to start Resource Monitor that works in all Windows versions is to search for the name of its executable file resmon or for Resource Monitor, and click or tap the search result with the same name.
If you want to know other methods to start Resource Monitor, read 11 ways to start Resource Monitor in Windows.
First look at the Resource Monitor. The Overview tab.
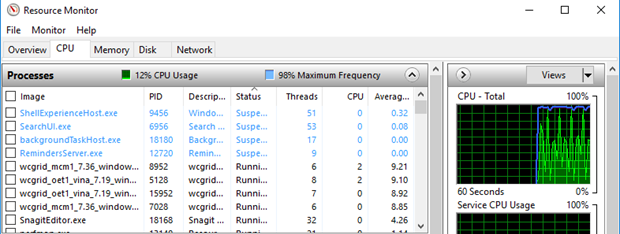
When you open the Resource Monitor (resmon), the application window is filled by the Overview tab. The Overview tab shows the CPU section by default. You can see that there are other tabs for Memory, Disk, and Network. In the lower part of the left-hand panel, there are collapsed sections for Disk, Network, and Memory (no idea why the order is different, and it doesn't matter). Clicking on the arrow at the right end of the title bar expands or closes the below list.
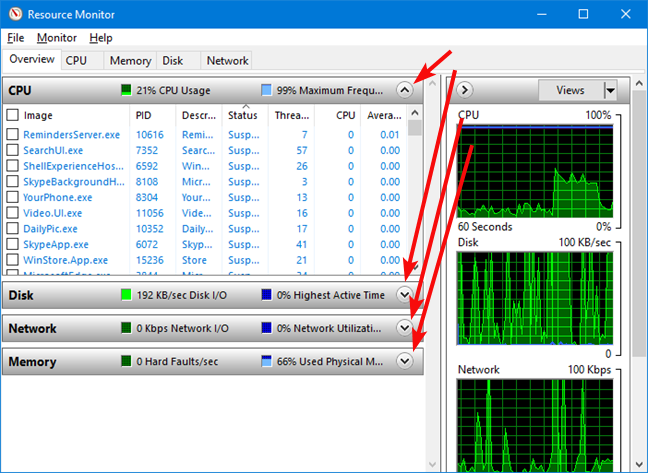
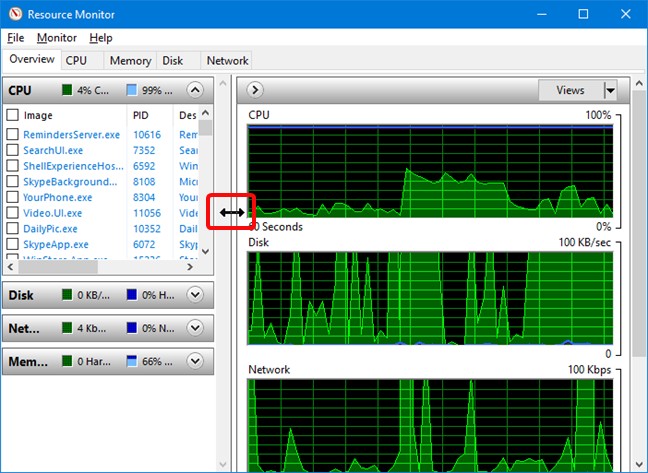
You can expand the Resource Monitor window to full-screen size so you can see more of what's going on. You can also drag the bottom border of the individual windows on the left to show more or less data at a time.
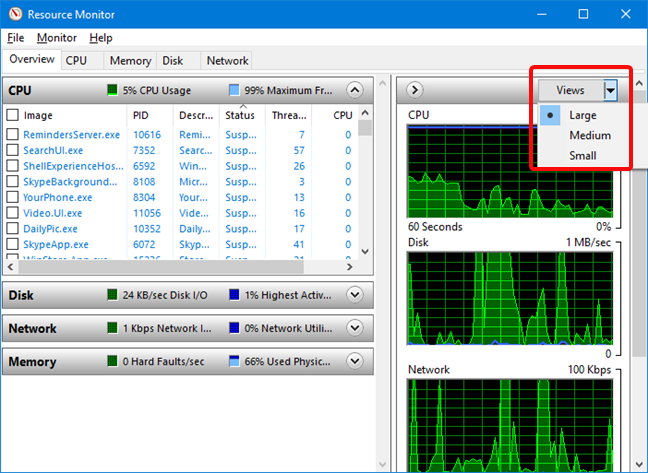
Each window shows a list of programs that are currently using resources, and the graphs on the right give you a visual representation of the totals. You can change the size of the graphs, by clicking or tapping on the Views button. The default view is "Large."
Watch the changing lists and graphs and see which programs are using your resources. We found it interesting that opera.exe (which is the executable of the Opera web browser) shows up multiple times on our list (each tab with its own executable). However, it's not easy to correlate a jump in the graph with an exact time and set of active resources.
How to monitor the CPU usage with Resource Monitor
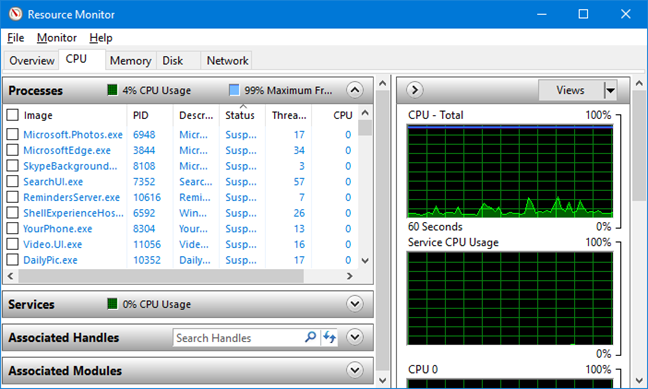
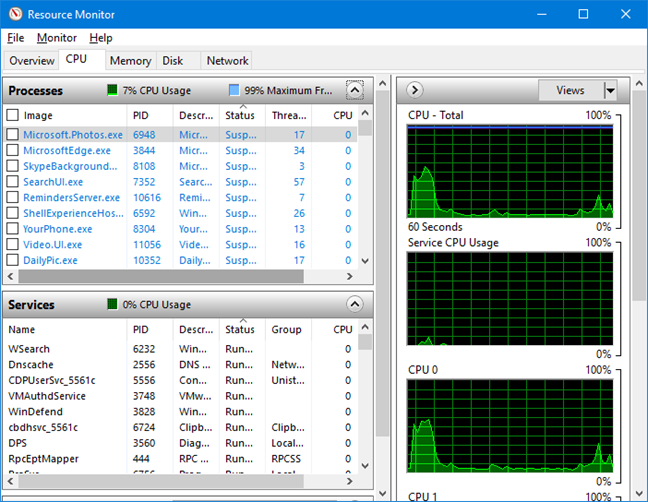
Let's start by exploring the CPU tab. It is easier to see all the information if you expand the Resource Monitor window to full-screen size (click on the Tile box in the upper right corner). Click on the CPU tab, and you find the Processes section expanded. Beneath that, there are collapsed windows for Services, Associated Handles, and Associated Modules. The processes in the list can either be running (written with black font) or suspended (written with blue).
Associated Handles and Associated Modules get populated with data only after you select a running process or service.
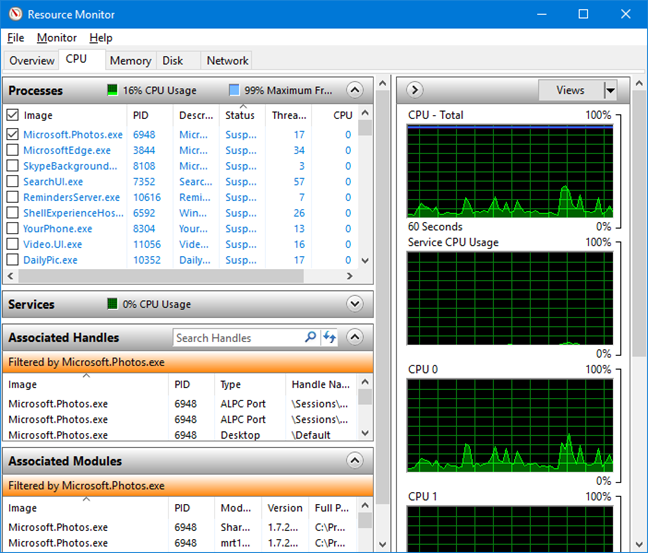
Modules are helper files or programs, such as the dynamic-link library (DLL) files used by the process you select. Handles are pointers that refer to system elements such as files, registry keys, events, or directories used by the selected process.
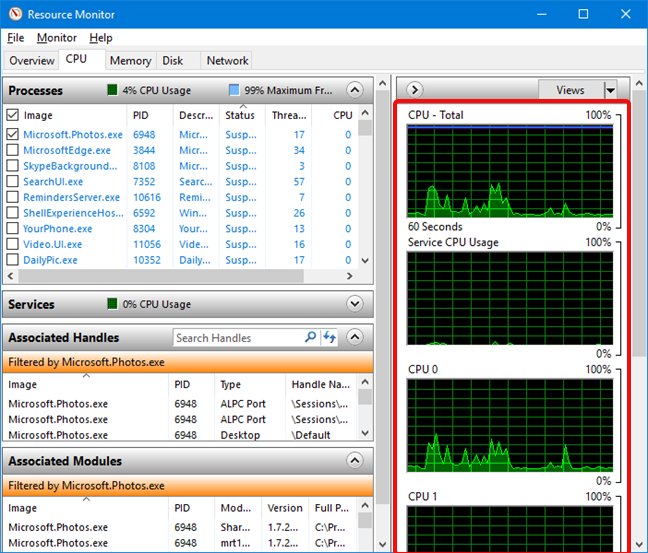
On the right, you see graphs of CPU usage that scroll to show you your data in real time. If you have a multicore CPU, the first two graphs show average data for all cores, while the others are independent for each core.
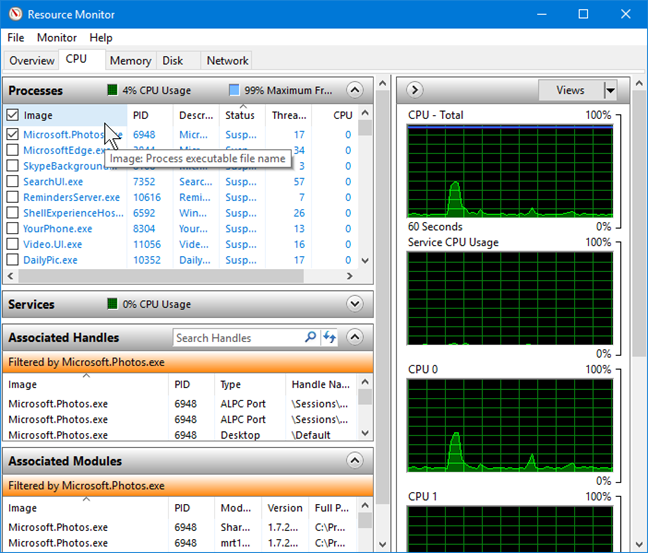
Let's look at the Processes section. On the left, you see a list of processes, the PID (process identifier), the name of the process (which is helpful for identifying what it is), its status (running, or otherwise), its threads (a core element of Windows processes that most people don't have to concern themselves with), CPU (processor usage at any one moment), and average CPU (usage averaged over time). If you cannot read the column headings or content, grab each column's divider in the title bar and slide them to the right one by one until everything is visible. If you hover the cursor over each column heading, a description of that column pops up.
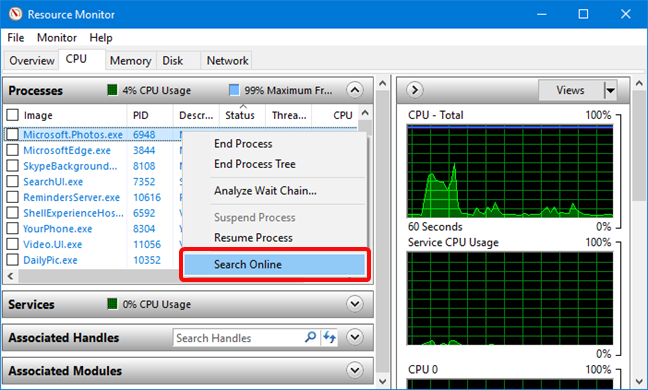
If you have any processes that are not responding, their names show up in red. What can you do with this list? Like many Windows programs, Resource Monitor lets you sort the contents of the columns in ascending or descending order. Click/tap on the Average CPU list, to sort it with the processes using the most resources at the top. Chances are good you do not see any big resource hogs since most Windows programs are well behaved. However, if you find your computer slowing down unexpectedly, take a look at this column. If something is taking up a lot of CPU resources, you may want to consider shutting it down and restarting it. If you are not sure what something is, right-click (or tap and hold) on the name and choose to Search online from the list. That pulls up a search for you with your default browser and search engine, and you can find out more about what each of those sometimes-cryptic names represents.
If a process shows up in red and its status is "Not Responding" or something similar, you can shut down that process by right-clicking on the process name and choosing "End Process."
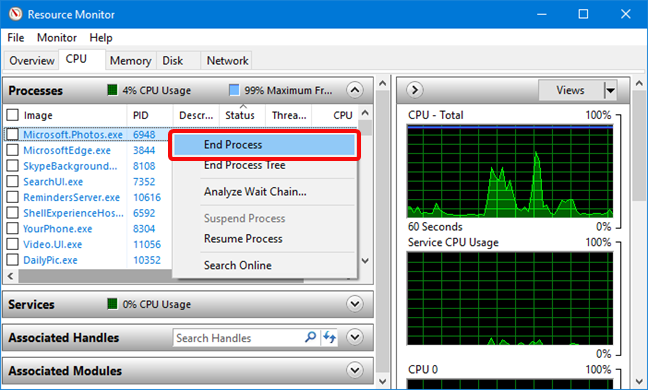
WARNING: Do not use "End process" unless you are sure you know what you're doing. Windows asks you if you are sure you want to end the process before it shuts it down. Some processes are interlinked and shutting down only one can wreak havoc on the others. Also, you do not want to end the SYSTEM process or svchost.exe that are critical to its operation. When ending processes, make sure you know what they are and what they do.
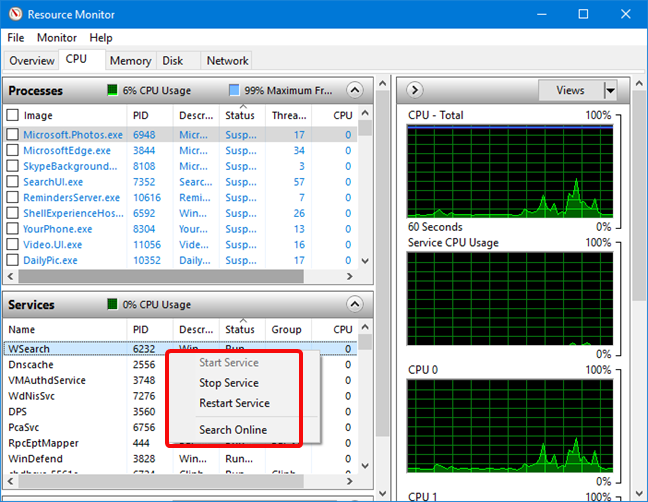
The Services section is similar to the Processes window. Try expanding it without collapsing the Processes window and take a look. You see a list of names that are different from the names in the Processes window, which also change as you watch. The difference is that these things are running Windows internal services.
If you select one or more of the running processes, the Service window shows only the services associated with those processes. If you right-click (tap and hold) on a service name, you see that you have the option to stop the service, restart it (in case it is malfunctioning, but you need to use it) or search for more information about it online.
Learn how Windows uses the Memory
Next, click or tap on the Memory tab. At the top, you see a list of the programs and processes that are using memory space, and at the bottom, a bar graph showing you where and how your available memory is in use. The columns are labeled Hard Faults/sec, Commit, Working Set, Shareable, and Private, each followed by (KB) - meaning memory space in kilobytes.
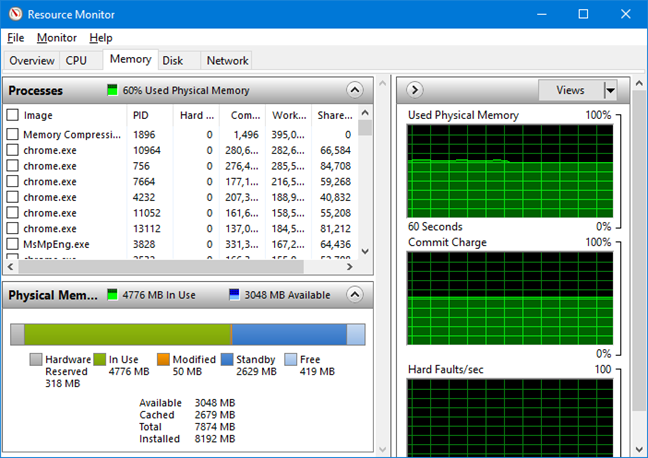
You probably do not see anything but zeroes in the Hard Faults/sec column. The term "hard fault" is somewhat misleading - it's not really a "fault" in the memory, it's an instance where Windows ran out of space in RAM and had to use the swap file (hard drive space that's set aside by Windows to be used when physical memory runs out). If you do see a lot of hard faults, it's a good indication that you need to buy some more RAM for your computer.
The Commit column shows you how much memory space Windows allocates for each program by default. The program may or may not be using all of that space. If your columns are not already sorted, click on this one to show you what's using up the most memory.
The Working Set column shows you how much memory each program is using at the moment.
The Shareable column shows you how much of the memory allocated to each program can be shared by other programs, and the Private column shows how much of the memory allocated to each program can be used only by that program. If a program shows up as using way too much memory, you can decide to close it.
The bar graph of memory use is self-explanatory, and so are the graphs that are shown on the right side of the Resource Monitor window.
What is holding the Disk? Monitor the Disk activity
The Disk section, as you may guess, shows you what is using hard drive resources. It can be useful if your hard drive light stays on and you are not sure why. There are three windows labeled Processes with Disk Activity, Disk Activity, and Storage. Expand them all and take a look. You probably also want to expand the column headings so you can see the whole title. In the column headings, "B/sec" stands for "bytes per second."
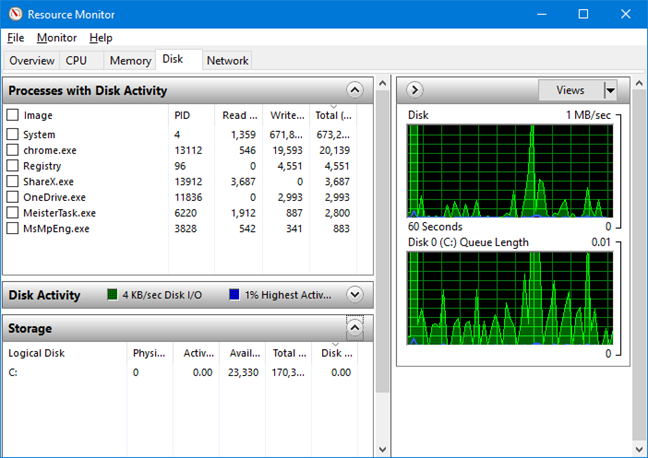
There is not a lot you can (or should) do with the information in this section. You might be surprised to see how much disk activity your favorite programs require, but again, since Windows programs are usually well behaved, it would be uncommon for you to see something going crazy and making your hard drive keep churning away, except for programs used to download files. As with the other Resource Monitor sections, you can right-click (tap and hold) on any name you do not know, and click/tap Search online to get an explanation (this works in the Processes with Disk Activity section only). You can also end those processes from the same right-click menu, but again, that is not recommended unless you know what you are doing. In the Disk Activity section, right-clicking on the names does nothing, so if you are curious about those, you have to look them up on your own.
The bottom section, Storage, shows a list of your drives with information on Logical Disk, Physical Disk, Active Time, Available Space, Total Space, and Disk Queue Length.
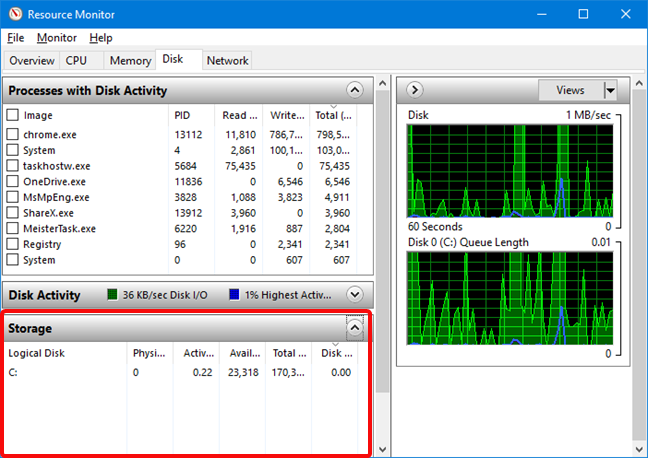
The first few are self-explanatory. "Disk Queue Length" is an indication of how many requests for disk space are waiting to be fulfilled. Unless you are doing something out of the ordinary or you have software that's seriously misbehaving, this column's data is mostly zeroes.
What is using the network and the internet
The final tab is Network. When you open this one, you see sections for Processes with Network Activity, Network Activity, TCP Connections, and Listening Ports. The first section is the only one you can do anything with; the others are for your information, but you cannot manipulate or change anything in them. TCP Connections and Listening Ports contain information that is useful to more advanced users, with good networking knowledge, so we won't be talking much about them.
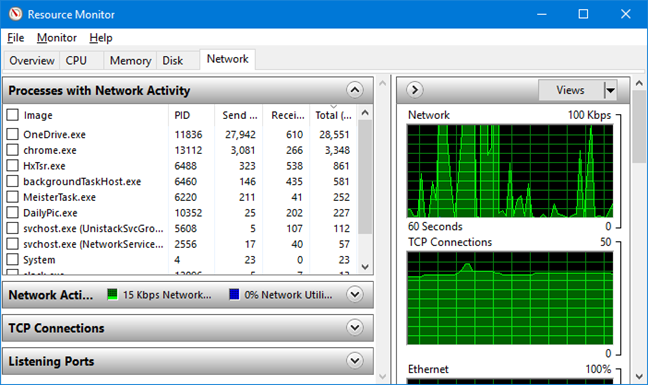
Take a look at the Processes with Network Activity section. Here you find a list of programs you are running, programs that are connecting to your network and the internet. You probably do not find any surprises here, since it is likely to be a list of browsers, instant messaging and other apps, network connection processes and programs like OneDrive and Dropbox that rely on cloud storage. If the names are too cryptic, you can use that excellent "Search Online" command from the right-click menu to see what they are.
One useful thing that you can do in this tab is to select only one process or a group of processes you are interested in, and the data in the lower sections are automatically filtered, so that you can see the Network Activity, TCP Connections or Listening Ports, only for the selection you made.
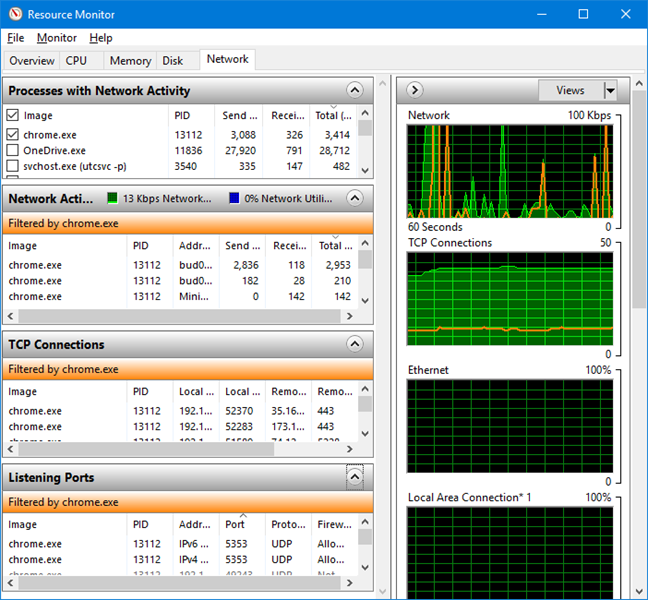
The graphs on the right are self-explanatory and show an overview of your network activity, TCP connections, and activity over your local area connection.
Did you find out how your resources are used in Windows?
The Resource Monitor (resmon) is an excellent way to have a look under the hood of Windows. It lets you look at what is going on behind the scenes, and stop the activity that is causing problems. As long as you proceed with caution, you can learn a lot about what is happening inside your computer and appreciate how Windows 10, Windows 8.1 and Windows 7 are designed to work.